Management accounting and reporting
What management accounting can answer and how reports on profit, cash movements and financial position work together.


In this article
A company reports a profit, but its cash balance tells a different story. In another case, sales rise and the owner cannot tell which business line contributes most. A bank statement shows cash movements and gives only part of the financial picture.
Management accounting organises data so management can understand results and make decisions. Its reports show income and expenses, receipts and payments, assets and liabilities. They are useful when the figures agree across reports and are available when needed.
What management accounting can answer
Management accounting supports decisions by owners and managers. Its scope follows the structure of the business and may cover business lines, projects, outlets and other agreed units of analysis. Comparisons require consistent rules across periods.
For example, a company may need to decide whether to keep a business line. It needs the line’s revenue, direct expenses and a reasonable share of common costs. Customer receipts alone do not show whether that line is profitable.
The system also helps explain changes. A decline in profit calls for checking sales volumes, prices, cost of sales, expenses and one-off events. A single headline figure rarely reveals the cause on its own.
Three connected reports
The profit and loss statement shows which income and expenses made up the result for the period. The timing depends on the agreed recognition rules. Cash can move earlier or later, so profit and the change in cash balance can differ.
The cash flow statement shows where cash came from and how it was used. It groups receipts and payments by type of activity. A loan or an owner’s contribution increases cash without generating sales revenue.
The management balance sheet shows assets, liabilities and equity on a given date. It shows how much money is tied up in inventory and receivables, what is owed to suppliers and how the company’s assets are financed.
The reports complement one another. If profit rises while cash falls, the balance sheet helps check whether inventory or receivables increased. Reconciling all three reports lets management focus on the cause of the change.

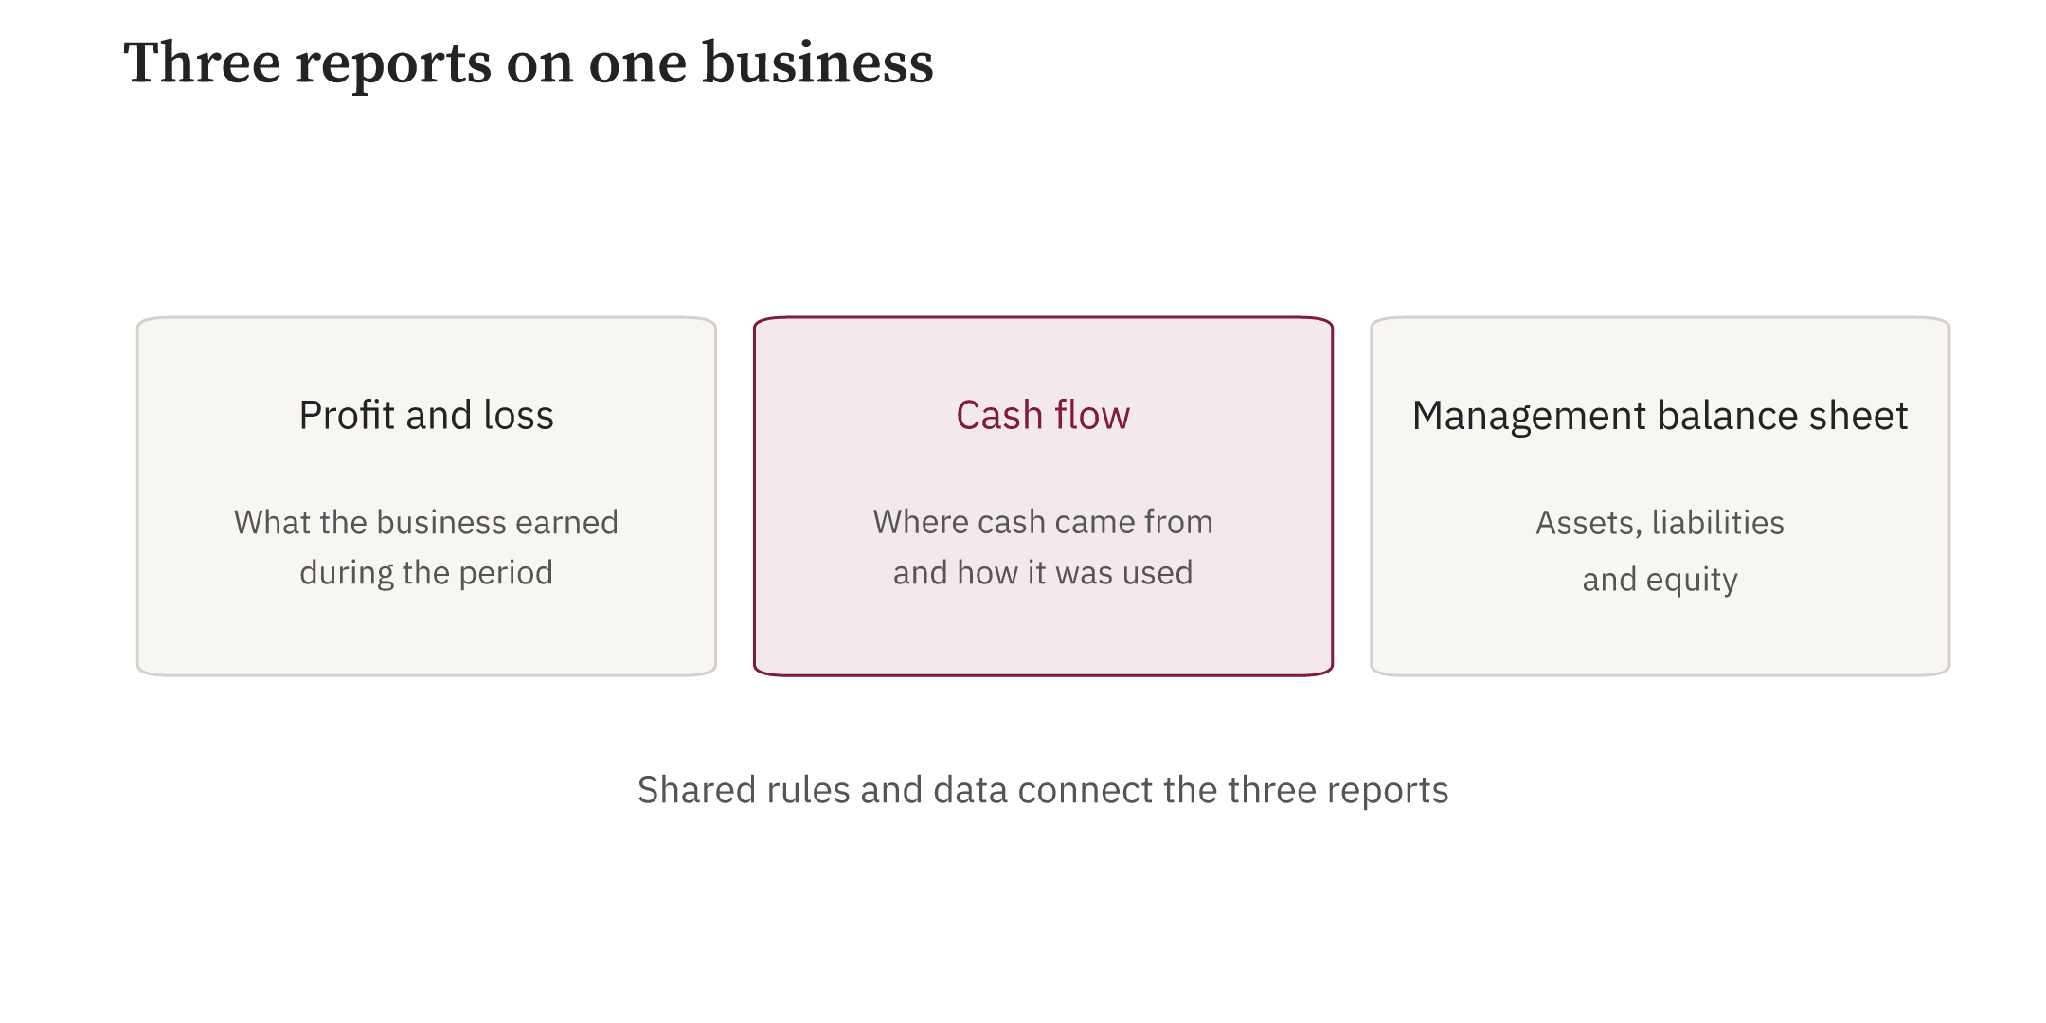
Diagram 1. The reports show the company’s performance, cash movements and financial position from different perspectives.
An illustrative example of profit and cash
At the start of the month, a company has 300 million Uzbek soums in its bank account. For simplicity, it has no inventory, outstanding balances or other assets or liabilities. Opening equity is also 300 million soums.
The company recognises 1,200 million soums in revenue during the month. Cost of goods sold is 850 million and other operating expenses are 120 million. Operating profit is 230 million, calculated as 1,200 − 850 − 120.
Customers pay 1,000 million, leaving receivables of 200 million at month-end. The company pays suppliers 1,050 million for inventory. It sells goods that cost 850 million and keeps the remaining 200 million in stock. It pays the full 120 million in operating expenses.
Cash falls by 170 million, calculated as 1,000 − 1,050 − 120. The closing balance is 130 million, or 300 − 170. The business earns 230 million in operating profit while cash flow from these transactions is negative by 170 million.
Two movements explain the difference. Customers still owe 200 million and another 200 million is tied up in unsold inventory. Together they absorb 400 million in cash, giving 230 − 200 − 200 = −170.

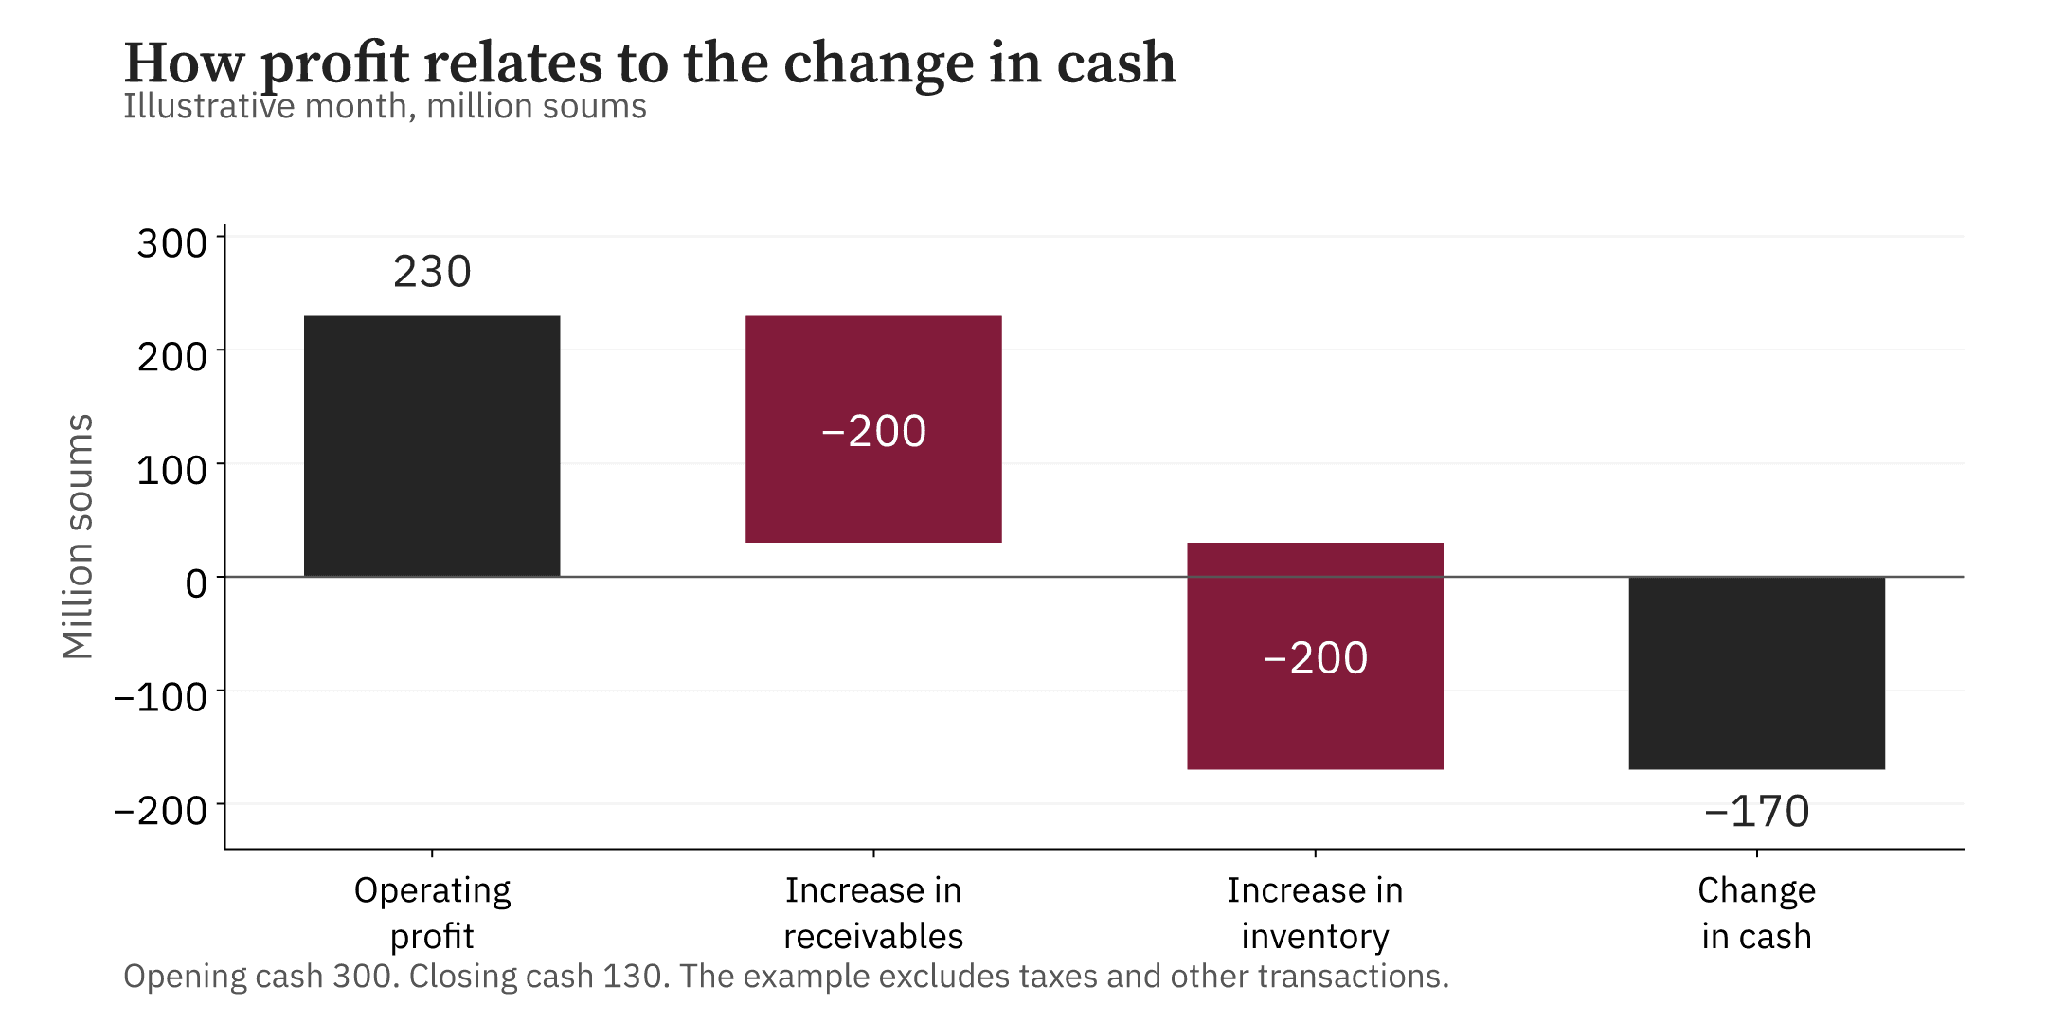
Chart 1. Illustrative example. Operating profit is 230 million soums, receivables and inventory each rise by 200 million, and cash falls by 170 million.
At month-end, the management balance sheet shows assets of 530 million soums, comprising 130 million in cash, 200 million in receivables and 200 million in inventory. There are no liabilities. Equity consists of 300 million in opening equity plus 230 million in operating profit.
The calculation is illustrative. It excludes taxes, interest, depreciation, investment and other transactions. Under these assumptions, the 230 million represents operating profit. All figures relate to one month.
What data a reliable result requires
Bank statements show payments. Accounting also requires the documents or other evidence behind transactions. Sales records support revenue, expenses are assigned to the correct period, and advances are recorded separately from completed deliveries. A business that sells goods needs inventory records and underlying product cost data.
The first step is to establish balances for cash, receivables and payables, inventory and other balance sheet items. Without these, transactions from earlier periods can appear as current revenue or expense. Each balance needs a source and a date.
Each data set should have an owner and a way to verify it. The company needs to know who provides sales figures, confirms costs and clarifies transactions in dispute. This reduces open questions at reporting time.
Accounting rules and comparisons across business lines
The rules specify when to recognise revenue, how to account for expenses and which transactions belong to a business line. Direct costs usually relate to a specific unit of analysis. Shared costs need a reasonable allocation method.
For example, shared office rent can be allocated using an agreed measure of use. The basis should match the analysis. If it changes without explanation, a difference in monthly profit may reflect the method rather than business performance.
If it helps with decisions, show the result before and after allocating shared expenses. Reporting formats should follow the company’s needs. More tables alone add little clarity.
At Asar Consulting, the parties agree on analytical dimensions and accounting rules during implementation. A new dimension or report may require a change in scope. This helps keep comparisons consistent and expectations clear.
How the reporting period closes
The team starts by collecting the complete set of data for the period. It then checks amounts, dates, accounts, outstanding balances and evidence for significant transactions. Internal transfers must be kept out of income and expenses, and repeated uploads must not create duplicates.
After processing the data, a specialist checks that the reports reconcile and prepares explanations. Significant differences need a breakdown. If any information is incomplete, this is noted beside the result and listed as an open issue.
The report is reviewed before presentation. Management then discusses the main changes and actions needed. For example, rising inventory may call for reviewing purchases, while rising receivables may call for checking payment terms and overdue balances.
Each decision should have an owner and a follow-up date. Reporting then informs action, and the next period shows how the figures changed after the decisions were implemented.
What regular reporting provides
A regular schedule makes trends comparable. Management can distinguish seasonal movements from persistent problems, assess a business line and adjust its action plan. This requires both an overview and explanations for the most significant variances.
A continuous record is especially useful before expansion, a price change or financing discussions. Established rules and historical figures help gather inputs for a separate calculation more quickly. Additional scenarios may still require a dedicated project.